Percent Failing
Reports > Percent Failing
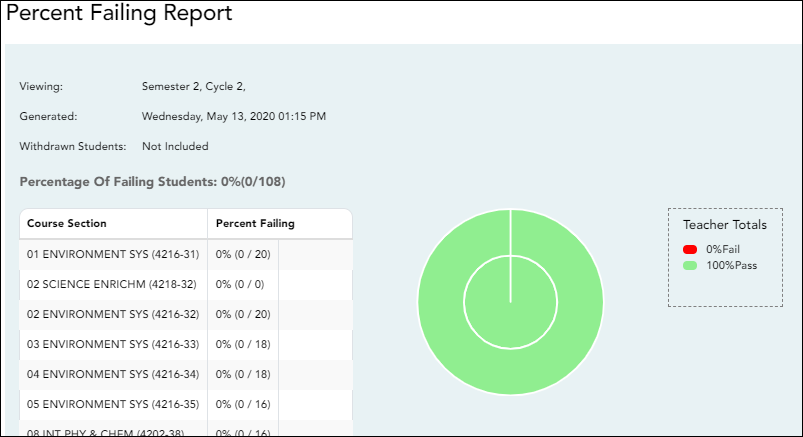
This report provides the percentage of a teacher's students who have a failing working cycle average for each class, as well as a total for all of the teacher's classes. The data can be displayed in a pie chart or grid format. Non-graded courses are not included.
Administrative users have the option to view the data for all teachers across the campus.
NOTE: Background colors may not automatically print, depending on your browser settings. For more information, click here.
Generate the report:
❏ Specify report options:
| Semester | The current semester is displayed. You can select a different semester. |
|---|---|
| Cycle | The current cycle is displayed. You can select a different cycle. |
| Viewing Options |
|
| Admin Options |
|
❏ Click Generate.
- The report opens in a new window, and you can print the report from that window.
- The report selection page remains open on your desktop.
