User Tools
Sidebar
Add this page to your book
Remove this page from your book
Cumulative Grade Averaging and Class Ranking
Grade Reporting > Utilities > Cumulative Grd Avg and Class Ranking
This utility uses grade averaging data for multiple years to determine class ranking. The program adds the values of each selected year and divides this by the sum of the courses factors for those years.
Two reports are generated:
- A report of options selected on the page and on the Campus Control Options tabs.
- A listing by the sort order selected. The report is similar to SGR2060 - Grd Avg and Class Rnk - Info ONLY no Update but includes totals.
Update data:
| School Year |
The current school year is displayed, as specified on Maintenance > Tables > District Control Table. |
||||||||
|---|---|---|---|---|---|---|---|---|---|
| Campus | The campus to which you are logged on is displayed. | ||||||||
| Campus Control Information |
Data from the Grade Averaging Information section on Maintenance > Tables > Campus Control Options > H Roll & Gr Avg is displayed for your reference. Verify the settings before running the utility.
|
| Credit Level |
Select the credit level to be processed. |
|---|
| Process |
|
|---|
| Grades |
Select the current year grade level(s) to process. Or, click All Grade Levels to process all listed grade levels. You must select at least one grade level.
It is common for campuses to run this utility for seniors once they have run early computations and determined the valedictorian and salutatorian. Once grades are final for the year, the campus may run the utility again for 12th grade (depending on district policy). |
|---|
| Other Options |
|
|---|
TIP: You can run the utility multiple times back to back, changing the settings of the Report Sort Order and Print Detail fields to get different reports:
- (Default) Report Sort Order is Grd Lvl, and Print Detail selected: Prints all years sorted by rank.
- Report Sort Order is Grd Lvl, and Print Detail is not selected: Prints one cumulative line per student.
- Report Sort Order is Alpha, and Print Detail is selected: Prints all years in alpha order.
- Report Sort Order is Alpha, and Print Detail is not selected: Prints one cumulative line per student in alpha order.
❏ Click Execute.
- When the process is finished, two reports are displayed. View the reports.
Review the report using the following buttons:
Click to go to the first page of the report.
Click to go back one page.
Click to go forward one page.
Click to go to the last page of the report.
The report can be viewed and saved in various file formats.
Click to save and print the report in PDF format.
Click to save and print the report in CSV format. (This option is not available for all reports.) When a report is exported to the CSV format, the report headers may not be included.
Click to close the report window. Some reports may have a Close Report, Exit, or Cancel button instead.
- Cumulative Grade Averaging Report - Options Selected - Displays the options selected when the utility was run.
- Grade Averaging Cumulative Report - Displays the results of the utility according to the selections of the Report Sort Order and Print Detail fields.
- A message is displayed indicating that cumulative grade averaging and class ranking is completed.
- Click OK.
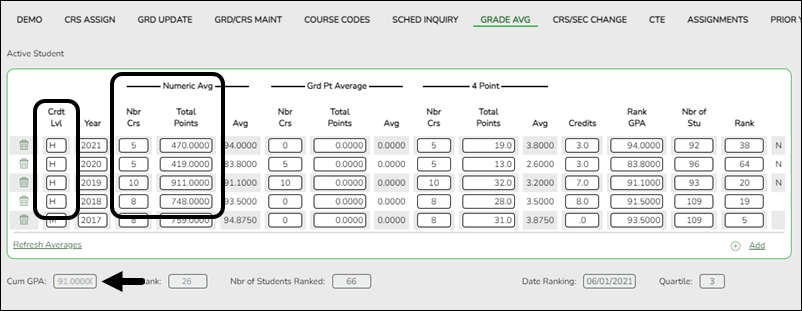
- The following fields are updated on Maintenance > Student > Individual Maint > Grade Avg:
Cum GPA
Cum Rank
Nbr of Students Ranked
Date Ranking
Quartile
Numeric Average Calculation
Total Points ÷ Nbr Crs with Crdt Lvl H = Cum GPA
Example: 2548 ÷ 28 = 91.0000
Grade Point Average Calculation
Total Points ÷ Nbr Crs with Crdt Lvl H = Cum GPA
Example: 80.3 ÷ 30 = 2.676
4 Point Average Calculation
Total Points ÷ Nbr Crs with Crdt Lvl H = Cum GPA
Example: 102 ÷ 32 = 3.187
NOTE: The cumulative 4 Point average does not appear on Grd Avg, but will print to the AAR - SRG2047 report.
Americans with Disabilities Act (ADA) and Web Accessibility
The Texas Computer Cooperative (TCC) is committed to making its websites accessible to all users. It is TCC policy to ensure that new and updated content complies with Web Content Accessibility Guidelines (WCAG) 2.0 Level AA. We welcome comments and suggestions to improve the accessibility of our websites. If the format of any material on our website interferes with your ability to access the information, use this form to leave a comment about the accessibility of our website.


