User Tools
Sidebar
Add this page to your book
Remove this page from your book
After running the Grade Averaging and Class Ranking utility, you can view and verify the student’s grade average and class ranking data on the maintenance page and on several reports.
Grade Reporting > Maintenance> Student > Individual Maint > Grade Avg
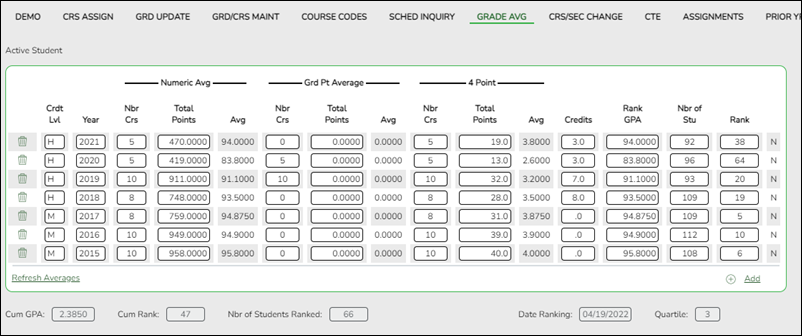
| Crdt Lvl | The field indicates if the row contains high school (H), middle school (M), or elementary school (E) data. |
|---|---|
| Year | The field displays the ending school year for the row of data. The student should have a row for each year he was included when the utility was run. |
| Numeric Avg | The fields contain data if the Grade Averaging and Class Ranking utility was run with Process set to Numeric Grade Averaging. Otherwise, zeros are displayed. Nbr Crs - the number of courses successfully completed that year Total Points - the number of points earned that year Avg - the calculated average for the year |
|---|---|
| Grd Pt Average | The fields contain data if the Grade Averaging and Class Ranking utility was run with Process set to Grade Point Grade Averaging. Otherwise, zeros are displayed. The fields may contain numeric values the grade average tables were built with numeric values instead of grade points. Nbr Crs - the number of courses successfully completed for the year Total Points - the number of points earned for the year Avg - the calculated average for the year |
| 4 Point | The fields contain data if College 4 Point Scale is 1 - Print & excl 0 wgt crs or 2 - Print & incl 0 wgt crs on the H Roll & Gr Avg tab. Nbr Crs - the number of courses successfully completed for the year Total Points - the number of points earned for the year Avg - the calculated average for the year |
| Credits | The field displays the total number of credits the student earned for the year. |
| Rank GPA | The field displays the student’s GPA used in determining his class rank. |
| Nbr of Stu | The field displays the total number of student’s in the student’s grade level when the Grade Averaging and Class Ranking utility was run. |
| Rank | The field displays the student’s rank out of the Nbr of Stu field. The student with the Rank field set to 1 has the highest GPA for his grade level. |
| In the far-right column, N or G is displayed to indicate if the student was ranked using numeric (N) or grade point (G) grade averaging. |
The following fields will display values once cumulative grade averaging is run, which calculates the student’s GPA and rank for the current and prior years. The process of running cumulative grade averaging is described later in this guide.
| Cum GPA | The field displays the student’s GPA for the current and prior years and is dependent on the number of years included. The student’s cumulative GPA can be printed on the multi-year AAR. |
|---|---|
| Cum Rank | The field displays the student’s cumulative rank, which indicates where the student’s cumulative average falls as compared to the other student’s averages in his grade level. |
| Number of Students Ranked | The field displays the total number of students ranked, which is based on the number of students in this student’s grade level at the time cumulative grade averaging was run. |
| Date Ranking | The field displays the date on which the cumulative grade averaging utility was run. |
| Quartile | The field displays value 1, 2, 3, or 4 indicating which quarter of the class the student falls into. The grade level population is divided into four quarters: Quartile 1 = 0 – .25 Quartile 2 = .25 – .50 Quartile 3 = .50 – .75 Quartile 4 = .75 – 1.00 The student’s cumulative rank is divided by the total number of students in the grade level: 135 / 541 = 0.249354 = Quartile 1 139 / 541 = 0.256931 = Quartile 2 272 / 541 = 0.502772 = Quartile 3 408 / 541 = 0.754158 = Quartile 4 Student’s who fall within the first quartile often qualify for college scholarships. |
Grade Reporting Reports > Grades > SGR2060 - Grd Avg and Class Rnk - Info ONLY no Update

SGR2060 provides a break down by school year for each student. The report is used to verify grade point, numerical, and four-point grade averaging data, as well as credits and class ranking for the year. The report can be used to troubleshoot abnormalities in a student’s record.
Grade Reporting Reports > Grades > SGR2070 - Grd Avg Info - By Student (Info Only)
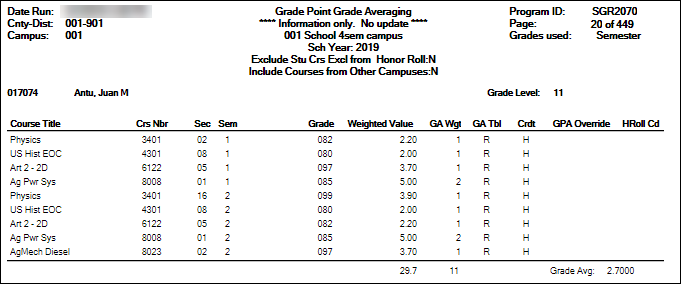
SGR2070 clearly shows how each student’s GPA was calculated for each course, including the weights, tables, and values. The report can be printed for one student, grade level, or campus. The Grade, Weighted Value, and GA Wgt fields can be used to verify the GPA calculations for each of the student’s courses.
Many campuses print this report at the end of the year to file in each student’s permanent record folder.
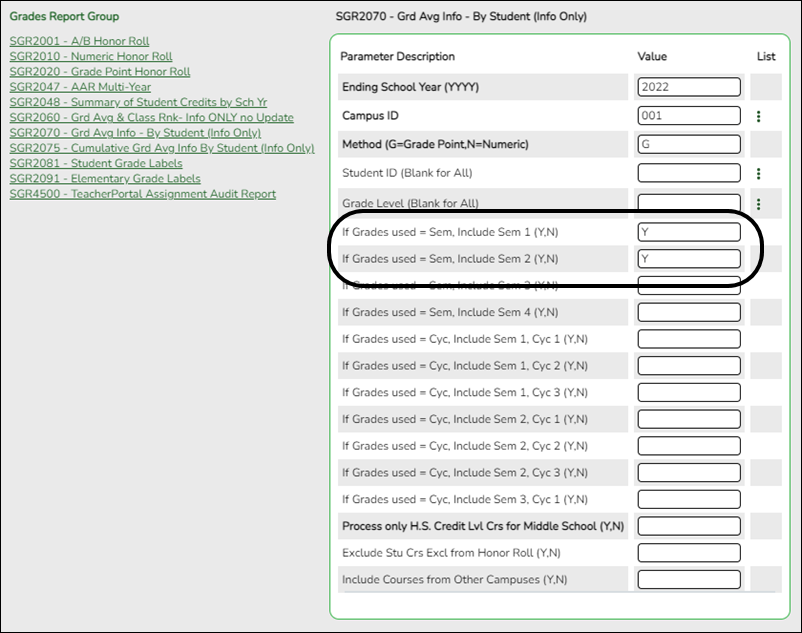
Example:
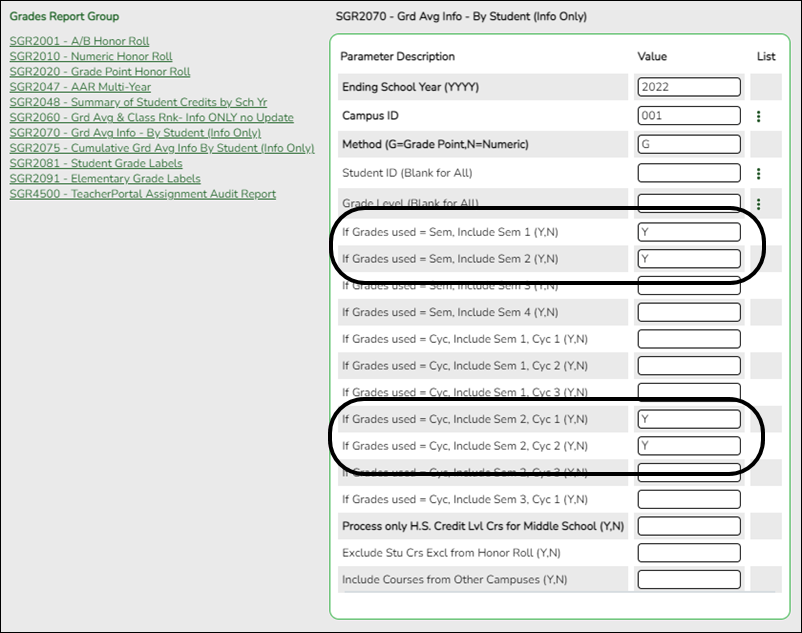
If you are running grade averaging early computation using the 4th and 5th cycle grades, enter the parameters as follows:
IMPORTANT: It is strongly recommended that you hand calculate the GPA for the top students in each grade level, and compare the hand-calculated GPA to the computer-calculated GPA. SGR1925 Student Course Information provides information to help with this process.
Grade Reporting Reports > Student Schedules > SGR1925 - Student Course Information
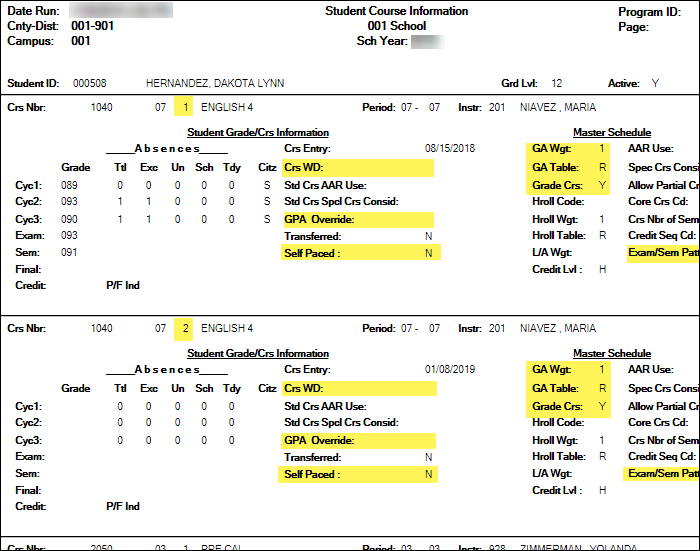
SGR1925 can be used to verify data and troubleshoot problems identified in the SGR2070 report.
The data in the report can be used to do manual calculations.
- The semester number is displayed between the course-section and course title.
- Note the Crs WD date. If withdrawn courses are not included, you must not include these courses in manual calculations.
- Note the GPA Override code if it exists. Note if it is different than the GA Table for the course. If the student’s grade averaging table is different than the grade averaging table for the course, his calculations will be different.
- If the Self Paced field contains Y, you must determine if the course should be included or excluded from calculations.
- The GA Weight is the number of times the course is counted in the GPA calculations, or if the course is excluded.
- The GA Table indicates the grade averaging table used for the course. Note if this is different than the student’s GPA Override code.
- In the Grade Crs field, note if the course is graded or not.
- For four-semester campuses, note the Exam/Sem Pattern. If set to 2, students only receive semester averages in semesters 2 and 4 for two-semester courses. One-semester courses can have semester averages in all four semesters.
Americans with Disabilities Act (ADA) and Web Accessibility
The Texas Computer Cooperative (TCC) is committed to making its websites accessible to all users. It is TCC policy to ensure that new and updated content complies with Web Content Accessibility Guidelines (WCAG) 2.0 Level AA. We welcome comments and suggestions to improve the accessibility of our websites. If the format of any material on our website interferes with your ability to access the information, use this form to leave a comment about the accessibility of our website.
